Regularised Linear Regression
- The goal of this project was to create a model that predicts the amount of water flowing out of a dam. This was done based on the changes of water level in a reservoir.
Visualising input dataset always helps to understand the geometry of data points.
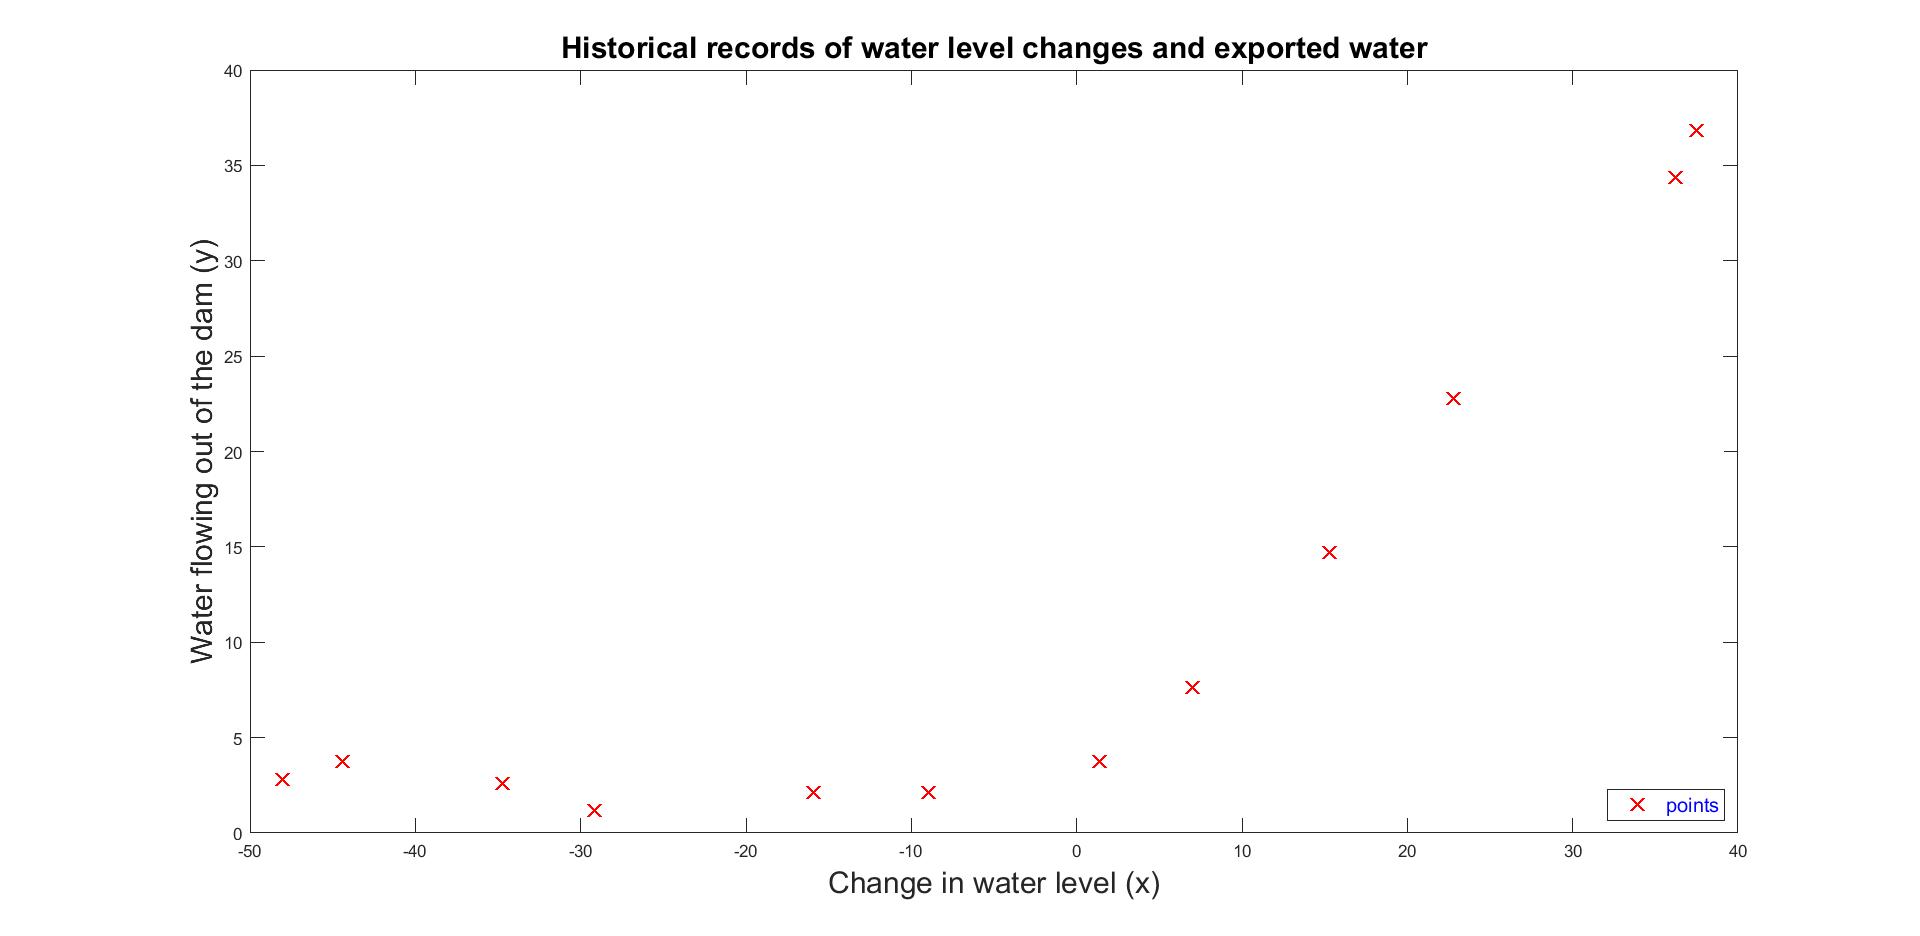
Figure 1: Input Dataset
As a first step, I applied linear fit, which is shown in Figure 2. Nevertheless, we see that the fit is not a good match due to the non-linear pattern of data. That means that the model underfits the input data.
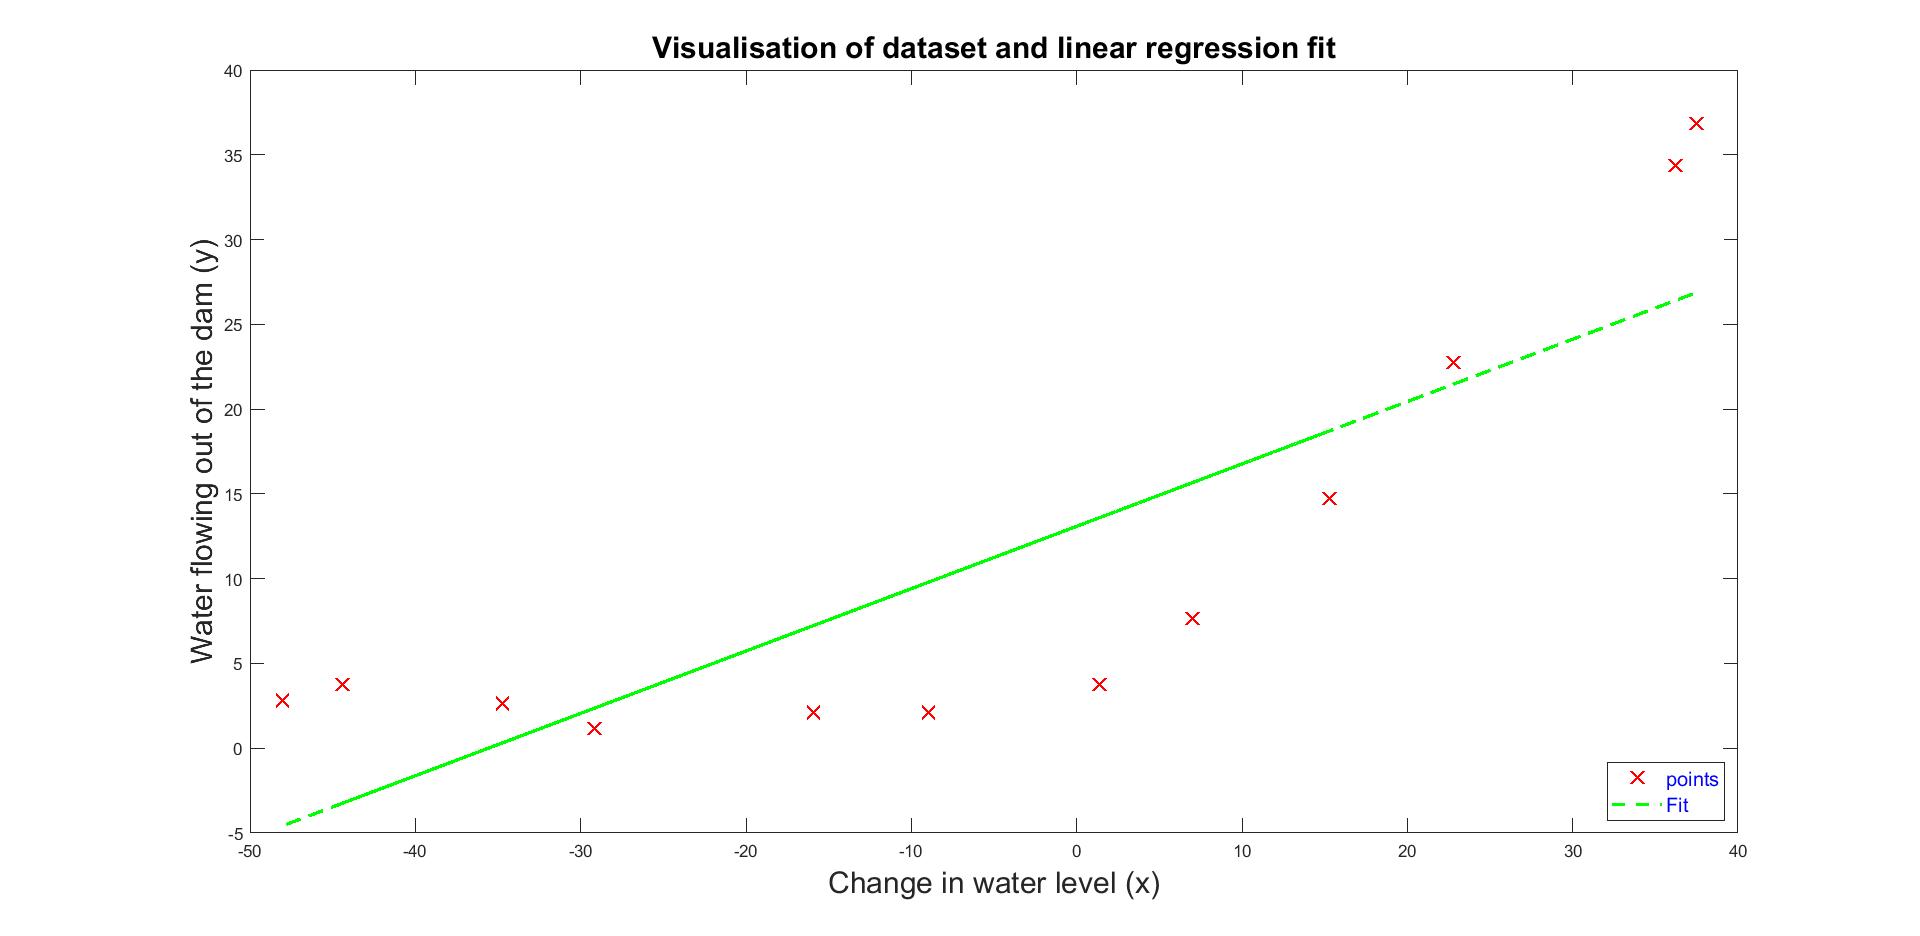
Figure 2: Linear Fit
Underfitting can be verified through learning curve of train and cross validation error over the training set size. In Figure 3 we see that when the number of examples increases, train and cross validation error are high, known as a high bias. Thus a more complex model is required.
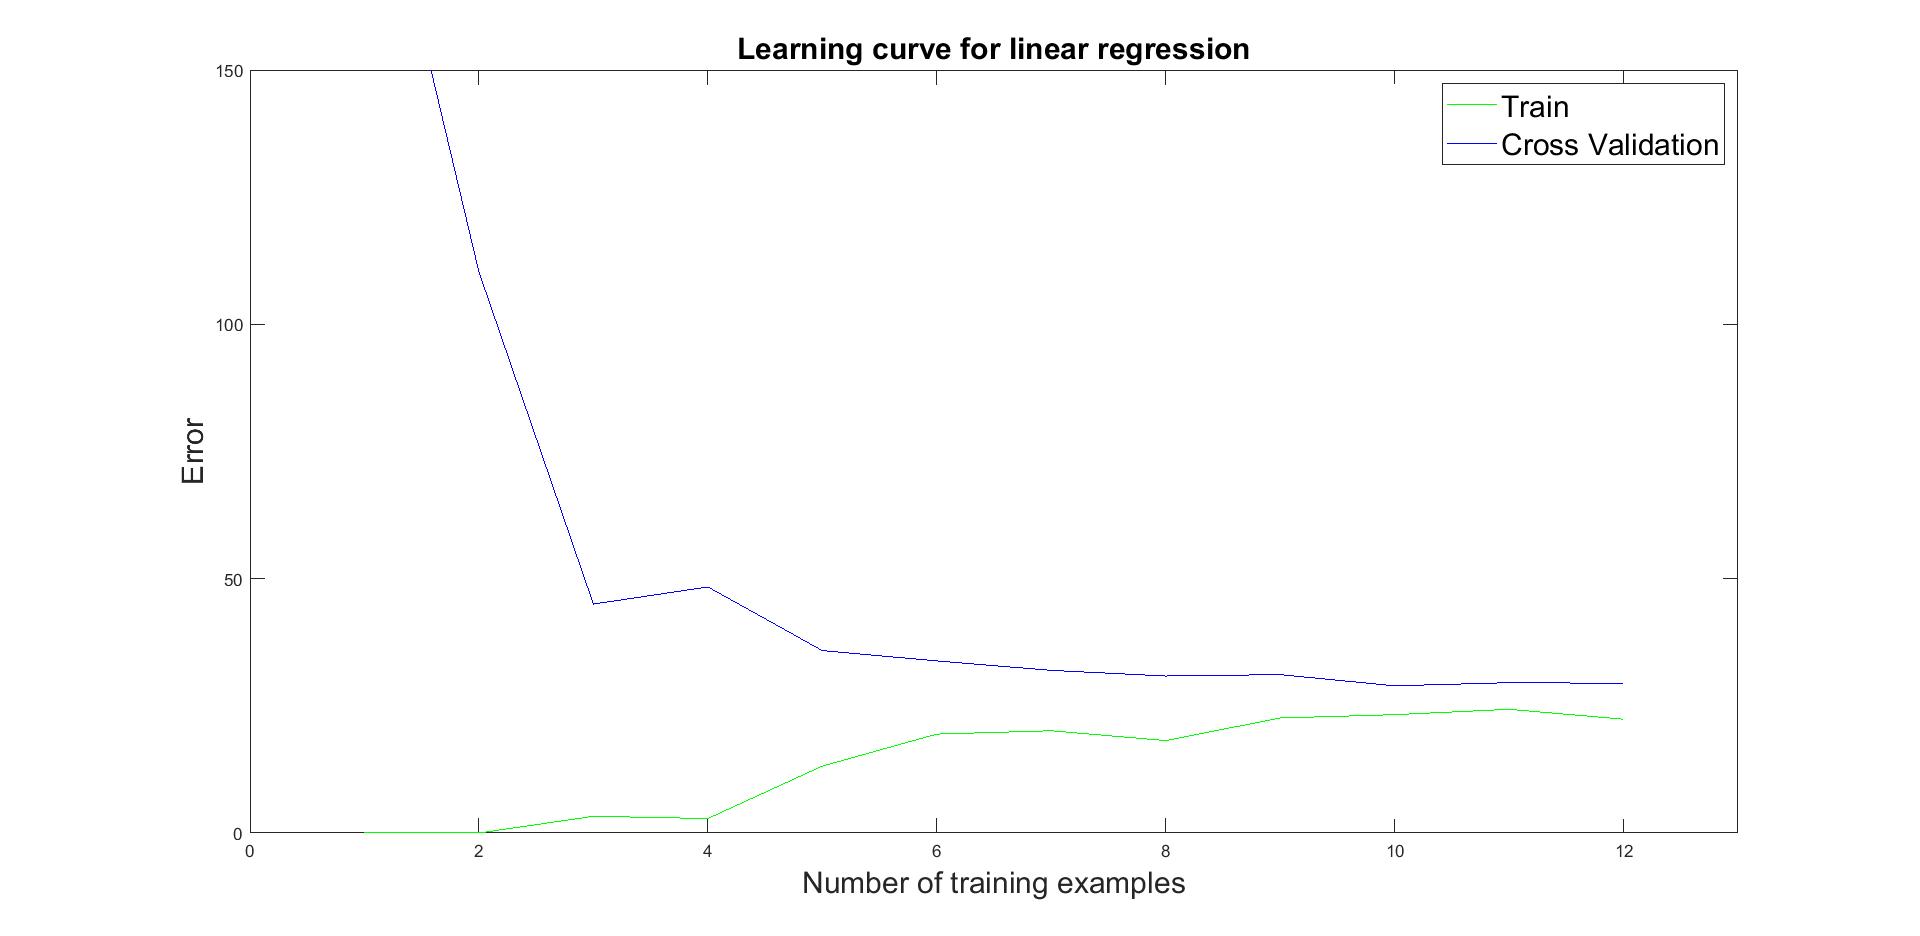
Figure 3: Learning curve of linear fit.
The above is addressed by introducing polynomial features and using regularisation parameter lambda. A fit of polynomial features of up to 8th degree and lambda equals to 1 can be seen is Figure 4.
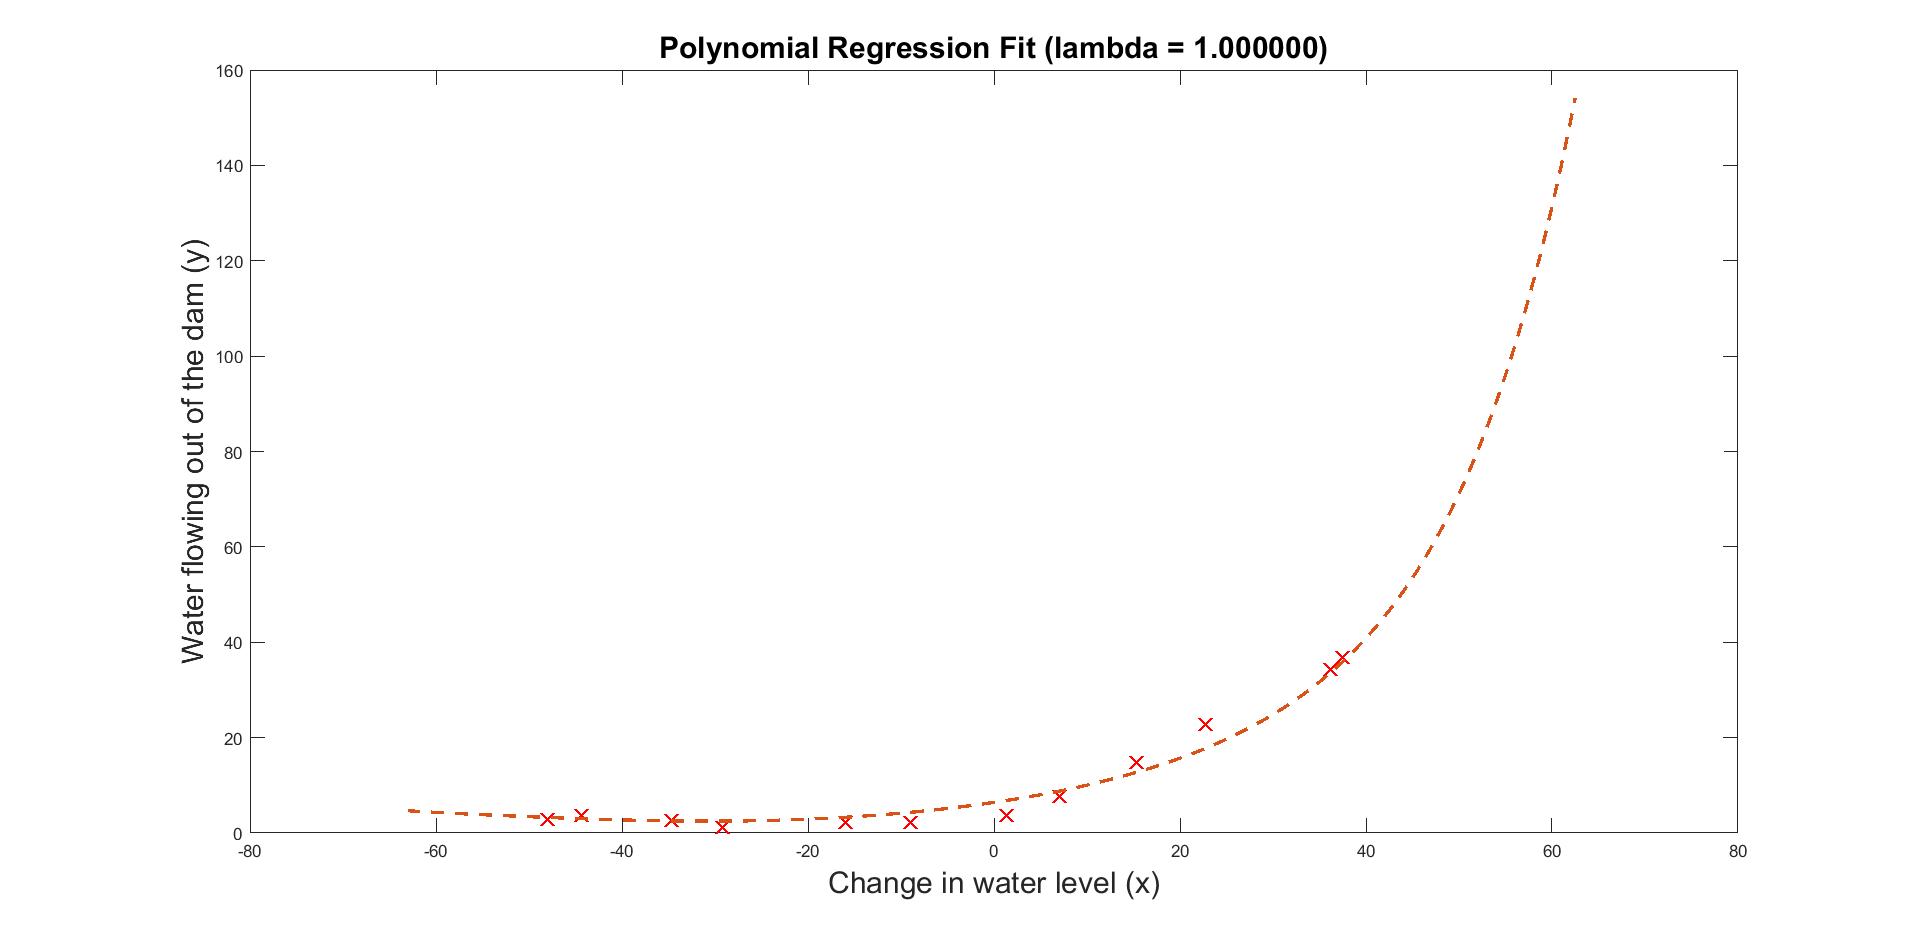
Figure 4: Polynomial fit of 8th degree
By calculating again the learning curve, we now see that training and cross validation error converge to roughly low values. Therefore, this lambda value consists a good trade-off between variance and bias.
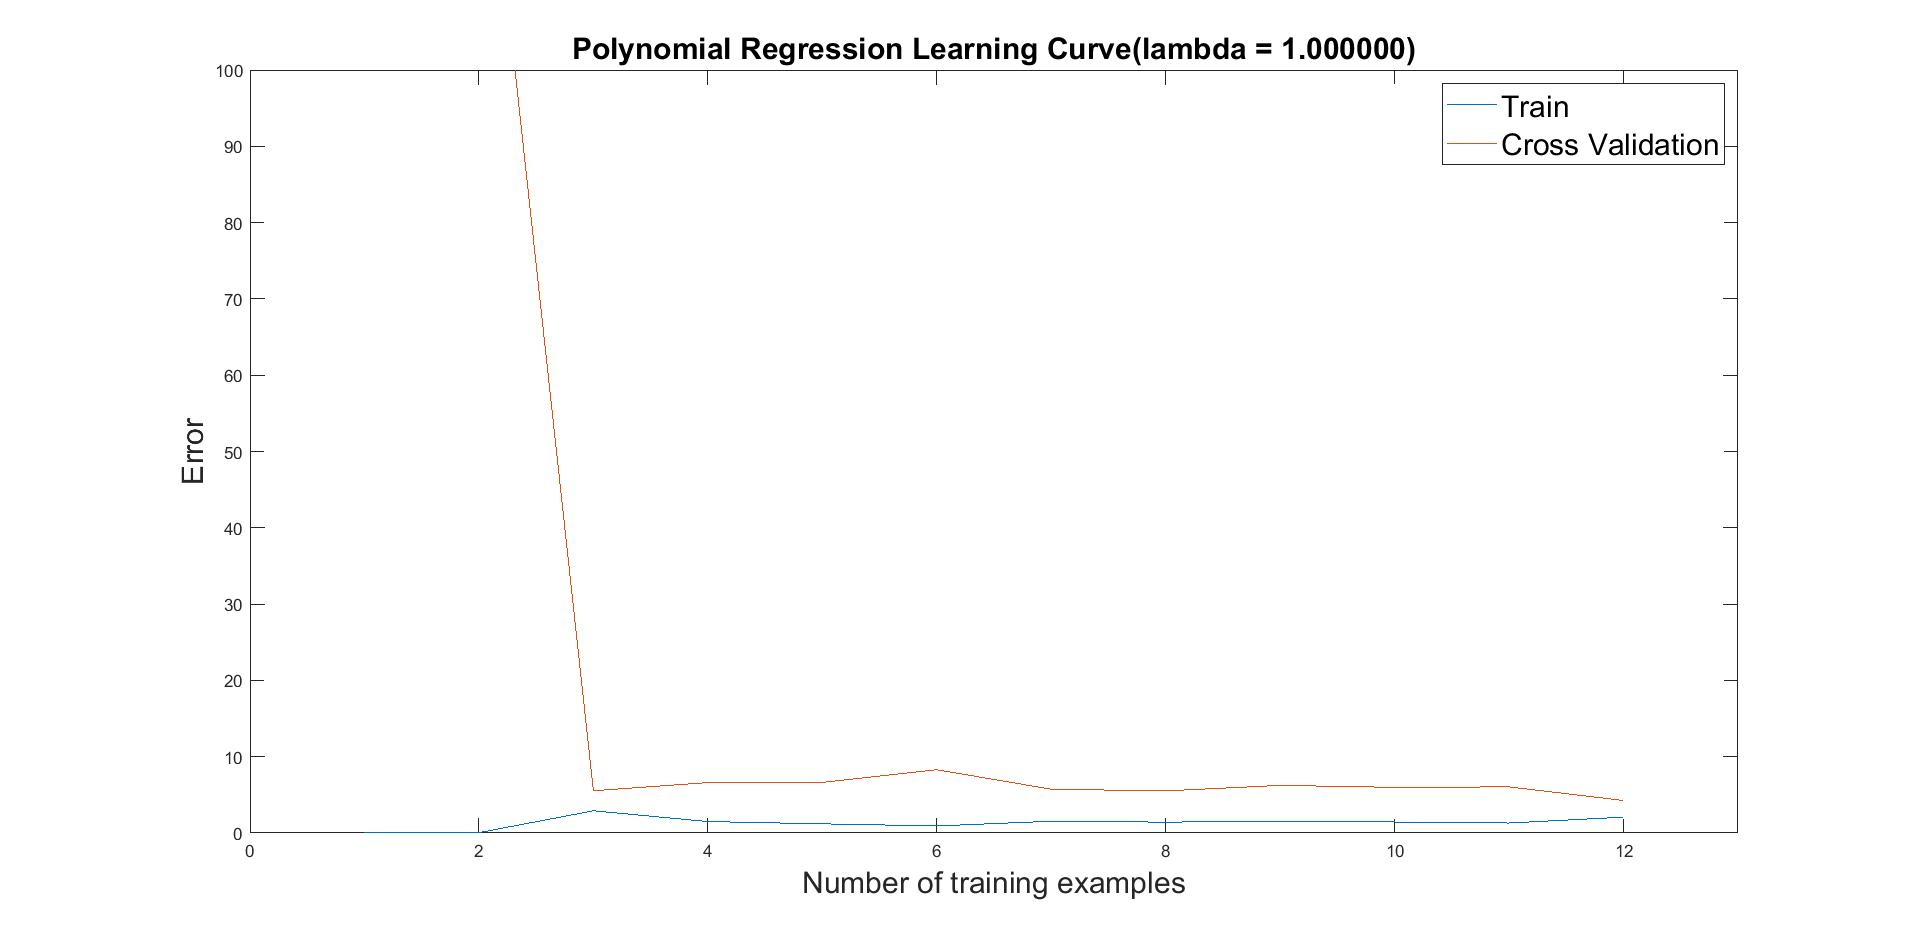
Figure 5: Learning curve of polynomial fit
As a last step, I performed a selection process of finding best lambda value through cross validation set.
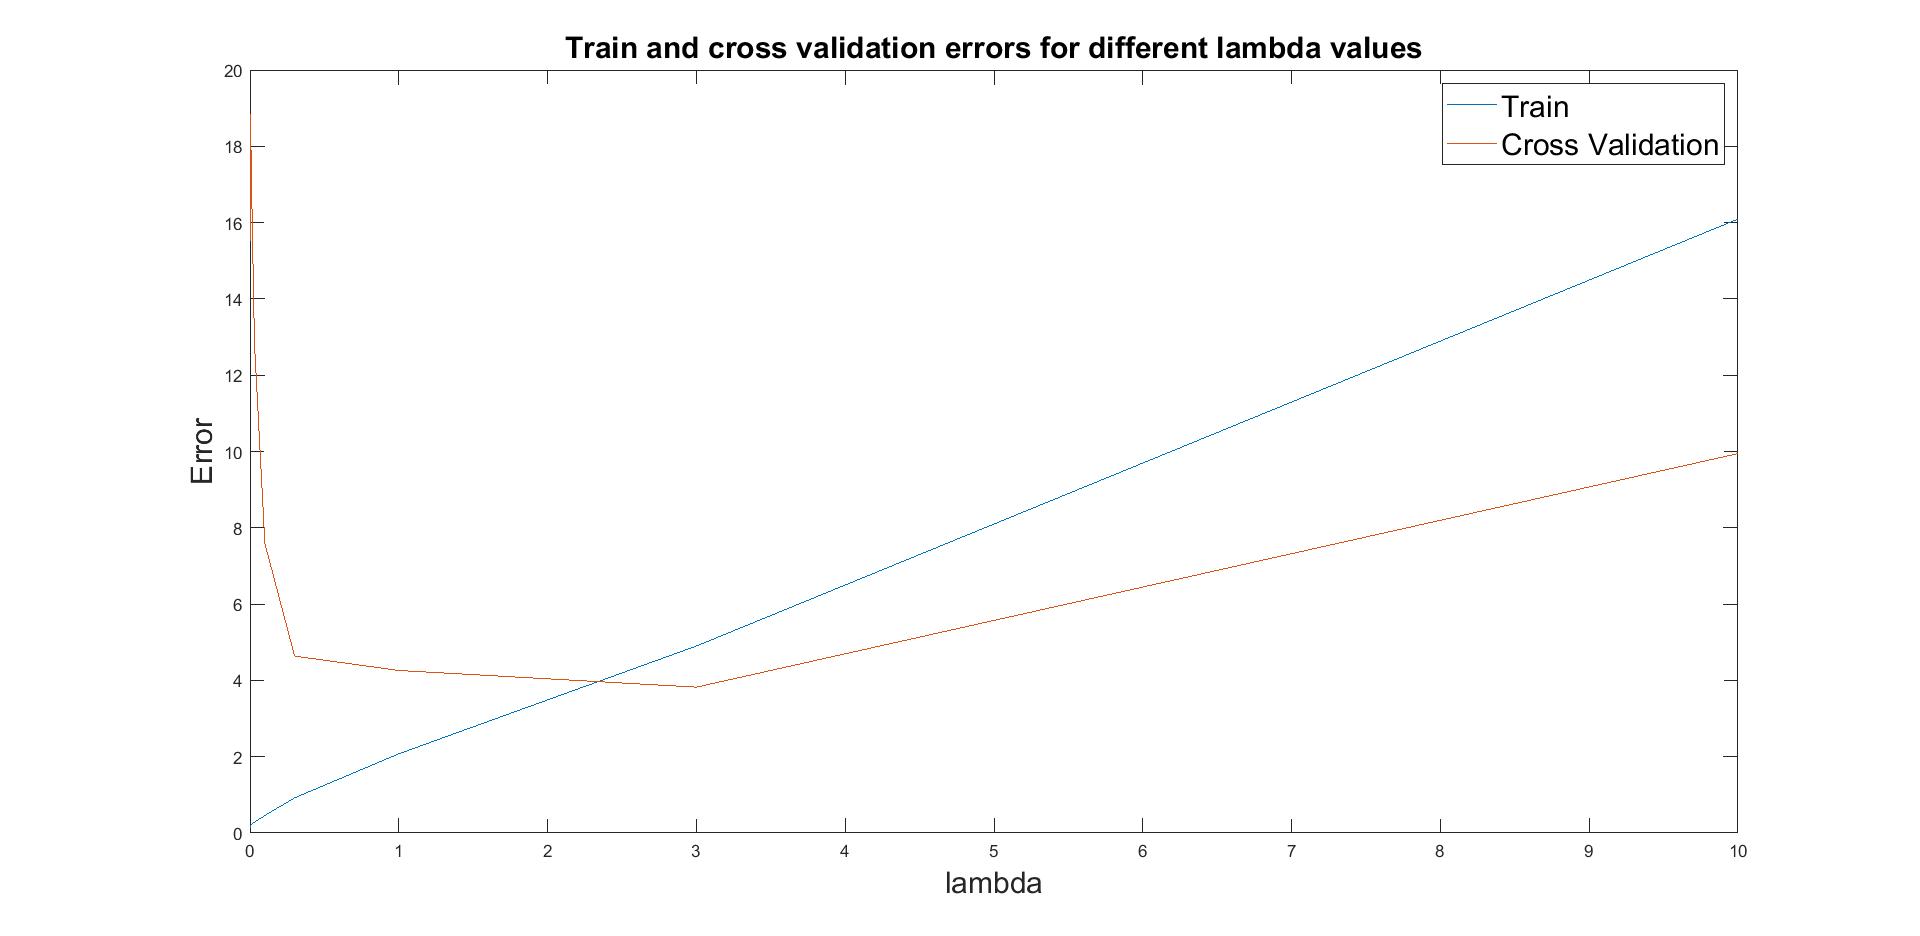
Figure 6: Selection process of lambda
In Figure 6, it can be seen that train and cross validation error converge for lambda=3, thus this is the proper value for regularised linear regression.
A more detailed description of this project’s implentation in Matlab can be seen in this github repository: Link to Github repository